Real-time cognitive load research platform
CogniSense
A multimodal research application that estimates mental workload from live EEG, facial expression and NASA-TLX surveys while participants complete controlled tasks.
- Context
- Research · Lockheed Martin–sponsored senior design, Gannon University
- Role
- Technical project lead on a student team
- Period
- Sep 2024 — May 2025 · Completed May 2025
- Stack
- Python, FastAPI, WebSockets, Lab Streaming Layer, NumPy
At a glance
- 01 · Problem
Researchers wanted to measure how demanding a task is while it happens, which means putting a 500 Hz brain-signal stream, emotion estimates and survey answers on one timeline.
- 02 · Solution
A Python service that computes a live EEG band-power ratio and streams it over WebSockets to a Next.js dashboard, plus gamified tasks, a NASA-TLX survey and a combined PDF report.
- 03 · Impact
A working end-to-end system used in live trials, with documented setup and test procedures so sessions are repeatable.
The problem
Human-factors researchers want to know how demanding a task is while it happens, not only from a questionnaire afterwards. That means putting very different signals on one timeline: a 500 Hz brain-signal stream, video-based emotion estimates and survey answers.
Architecture
Approach
A Python service resolves the EEG headset's Lab Streaming Layer stream (8 channels at 500 Hz), keeps a rolling buffer per channel and, once a full second of data is available, computes beta (13–30 Hz) over alpha (8–12 Hz) band power with Welch's method, averaged across channels.
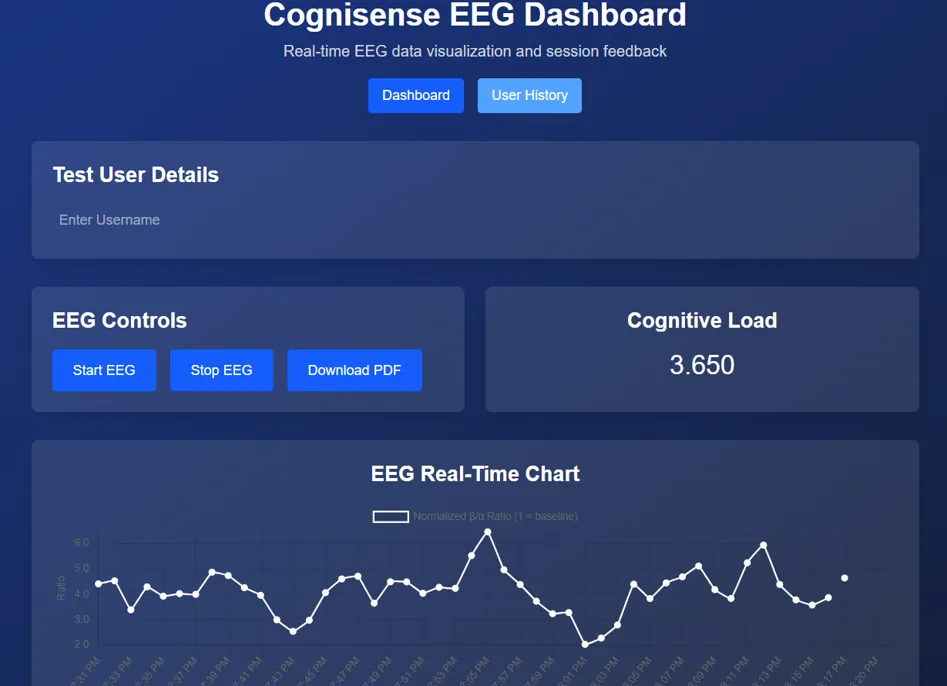
The service exposes start and stop endpoints and streams the ratio over a WebSocket to a Next.js dashboard, which charts it live against a baseline.
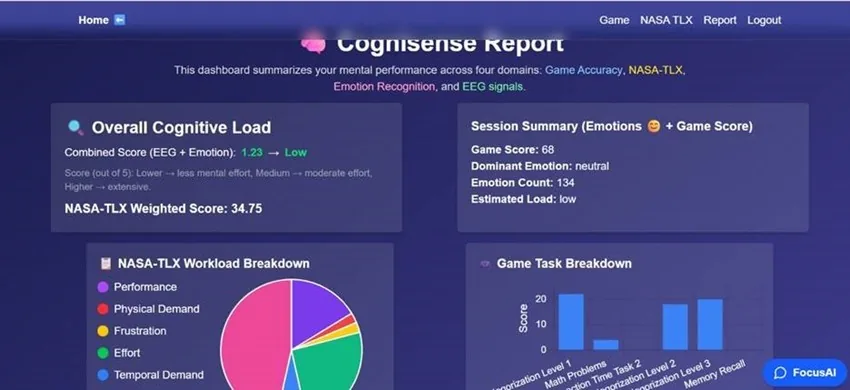
Participants complete gamified tasks (memory, math and categorization levels, with optional audio distractions) and a NASA-TLX survey. A report page combines the EEG score, emotion summary, TLX weighting and task results, and exports to PDF.
What was built
- 01Live EEG band-power ratio over WebSockets
- 02Session controls and per-user history
- 03Gamified cognitive tasks with distraction conditions
- 04NASA-TLX weighted workload survey
- 05Facial-expression summary per session
- 06Combined report with PDF export
The hard parts
Keeping signals on one clock
EEG samples arrive far faster than UI updates or task events. Buffering per channel and computing on fixed one-second windows gave the dashboard a steady, comparable series.
Hardware in the loop
Most bugs lived between the headset, the streaming layer and the backend. They were found with logs and repeatable test sessions, then written into the setup procedure.
Usable by non-engineers
Researchers run sessions, not code. The dashboard keeps to start, stop and export, and the report explains each score in plain terms.
Working across disciplines
Frontend, hardware and research teammates each owned a piece. My job was making those pieces meet: shared data formats, timing and documented setup.
Outcome
- Working end-to-end system used in live trials
- Documented setup and test procedures for repeatable sessions